Win by Not Losing
Most investors are taught to focus on returns: finding the best fund, the hottest sector, or the “next big thing.” But the chart makes a quieter (and far more useful) point:
Your long-term results aren’t determined only by how much you make. They’re heavily determined by how much you avoid losing—especially early on.
What the above chart is really showing
The chart starts with a simple goal: earn an average growth rate of 6% over a 5‑year period. Sounds reasonable. Then it asks a painful but realistic question:
What if Year 1 is negative?
How strong do the next four years have to be to still hit your original goal?
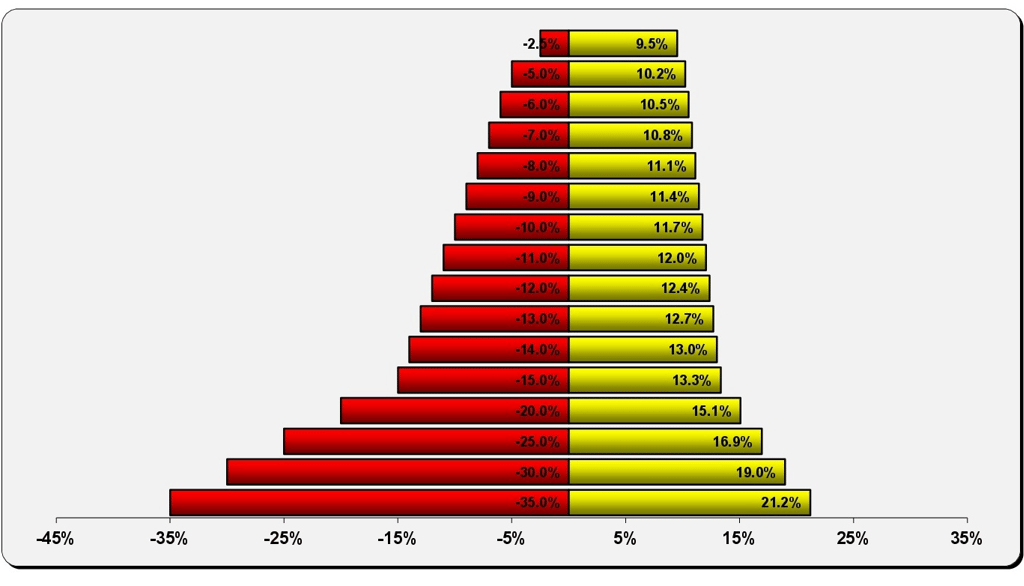
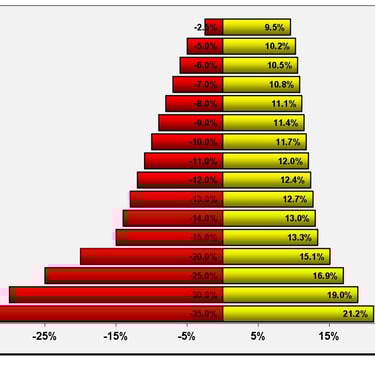
On the left side, you see a first-year loss (e.g., −5%, −10%, −20%, etc.).
On the right side, you see the required annual growth rate for the remaining four years to get back on track. And the required number jumps—fast. Here are a few examples straight from the chart:
Down −5% in Year 1 → you now need about +10.2% per year for the next 4 years
Down −10% in Year 1 → you need about +11.7% per year for the next 4 years
Down −20% in Year 1 → you need about +15.1% per year for the next 4 years
Down −35% in Year 1 → you need about +21.2% per year for the next 4 years
A single bad year doesn’t just hurt—it raises the bar for every year after it.
Note: Depending on how someone defines “average return” (simple average vs compounded growth), the exact hurdle rate can vary. The lesson doesn’t: losses create a steep, time‑compressed recovery problem.
Why losses are different than gains (the recovery math)
A 10% gain and a 10% loss are not mirror images.
If you go from $100 to $90 (−10%), you don’t need +10% to recover.
You need +11.1% to get back to $100.
That’s because the gain has to happen on a smaller base. This is why avoiding loses matters so much: The bigger the drop, the more “perfect” your future returns must be just to catch up.
The hidden issue: time is the real cost
A big loss early in a multi-year plan doesn’t only reduce your balance. It steals time, and time is what makes compounding work. The chart is essentially saying:
“You had 5 years to reach your goal.”
“Now you have 4 years to do what you hoped to do in 5.”
“Good luck.”
That time compression is why the required rates start looking unrealistic quickly.
“Average returns” can lie to you (a quick $100 example)
People often assume: “If the average return is the same, the result should be the same.” Not true. Let’s do a simple two-year demonstration with $1,000:
Portfolio A (steady)
$1,000.00 Year 1: +6% = $1,060.00
$1,060.00 Year 2: +6% = $1,123.60
Final: $1,112.36
Portfolio B (volatile)
$1,000.00 Year 1: +25% = $1,250.00
$1,250.00 Year 2: −13%= $1,087.50
If you just “average” those two returns, you might think it’s similar (because +25 and −13 net to +12, same as 6+6). But the dollars say otherwise:
Final: $1,108.75
Same “average return” total, yet different ending value—because volatility has a cost.
What this means in real life, and why people make it worse
When a portfolio takes a big hit, investors typically react in one of two ways—both risky:
1) Panic selling - “I can’t take this anymore”
They sell after losses, locking them in, and often miss the recovery.
2) Recovery chasing - “I need to make it back fast”
They crank up risk to try to earn higher returns (15%, 19%, 21%… every year). That often leads to:
concentrated bets
leverage risk
speculative “hot” ideas
ignoring diversification
abandoning the plan
This is where a temporary downturn can turn into a permanent setback.
How to “win by not losing” (practical, boring, effective)
This is not about eliminating risk. It’s about taking the right amount of risk—so one bad year doesn’t force you into extreme behavior. Here are the habits that help most:
1) Match Your Portfolio to Your Timeline, Not Your Optimism
Optimism is a great trait for a person, but it’s a dangerous strategy for a portfolio. If you are planning for a house down payment in two years, a child’s tuition in three, or your own retirement spending in five, you cannot afford to be "all-in" on high-volatility assets.
When your timeline is short, your capacity for recovery is even shorter. As the chart shows, a single bad year can force you into a position where you need "miracle returns" just to get back to your original goal. By matching your investments to when you actually need the cash, you ensure that a market dip is a temporary headline, not a life-altering disaster.
2) Diversify Like You Mean It
Many investors think they are diversified because they own five different "Growth" funds. In reality, they often own five versions of the same thing. When the tech sector or the S&P 500 drops, all five of those investments often go down together. That isn't diversification; it’s just duplication.
True diversification means owning assets that don't move in lockstep. It means spreading your risk across different "drivers of return"—different industries, different asset classes, and different geographic regions. When one part of your portfolio is struggling, another should be holding the line. This is the only "free lunch" in investing, and it’s your primary defense against the deep red bars on the left side of our chart.
3) Build a "Financial Firewall" with a Cash Buffer
Most "bad" investing decisions aren't actually investing problems—they are cash-flow problems in disguise. When an unexpected medical bill, home repair, or job loss occurs, investors without a cash buffer are forced to sell their stocks to raise money.
If that happens during a market downturn, you are effectively "locking in" your losses at the worst possible time. A healthy emergency fund acts as a financial firewall, it gives you the "staying power" to let your investments recover, ensuring you never have to sell a great asset at a fire-sale price just to pay your mortgage.
4) Rebalance to Kill the "Risk Drift"
After a long bull market, your portfolio "drifts." If you started with 60% stocks and 40% bonds, a few years of growth might leave you with 80% stocks without you even realizing it. You are now taking significantly more risk than your original plan intended.
Rebalancing is the disciplined process of selling a bit of what has done well (selling high) and buying a bit of what has lagged (buying low). It’s the most effective way to keep your risk level consistent. By rebalancing, you ensure that when the next market correction hits, you aren't over-exposed and vulnerable to the kind of catastrophic loss that takes years to overcome.
5) Obsess Over What You Can Actually Control
The media wants you to obsess over the things you cannot control: the Fed’s next move, the latest geopolitical crisis, or tomorrow’s market close. This is a recipe for anxiety and poor decision-making. Instead, focus your energy on the "Big Five" levers that actually determine your success:
Costs and Fees: Every dollar you pay in high management fees is a dollar that isn't compounding for you.
Tax Efficiency: It’s not what you make; it’s what you keep after the IRS or CRA takes their cut.
Risk Level: Ensuring your portfolio matches your actual ability to stomach a loss.
Behavior: Staying disciplined when everyone else is panicking or chasing hype.
Savings Rate: Your contribution rate is often a bigger factor in your final wealth than your investment return.
By focusing on these controllable factors, you stop being a victim of the market and start being the CEO of your own financial future.
Where Hourly-Only Planning Fits In: The Power of Unbiased Analysis
This chart is the ultimate proof that planning beats prediction. While the rest of the world is busy trying to predict what the market will do next month, an hourly-only planner is busy building a plan that works regardless of what the market does.
At the Hourly Financial Advisor Network, we believe that the best advice comes from someone who has no "skin in the game" other than your success. Because our advisors are paid strictly for their time and expertise—not through commissions or a percentage of your assets—their loyalty is 100% to you.
Here is how an hourly-only professional changes the math in your favor:
Brutal Honesty through Pressure-Testing: Most traditional advisors show you "Monte Carlo" simulations that look like a beautiful rainbow of possibilities. An hourly planner does the opposite: they "stress-test" your life against the red bars on this chart. They’ll show you exactly what happens to your retirement date if the market drops 20% tomorrow, giving you the clarity to adjust before the storm hits.
Asset Allocation Without an Agenda: A traditional advisor might keep you "fully invested" because their paycheck depends on your assets being in the market. An hourly planner has no such conflict. If your goals only require a 4% return to succeed, they will tell you to stop taking 10% risk. They help you find the "Minimum Effective Dose" of risk needed to reach your finish line.
Eliminating the Need for "Miracle Returns": The biggest danger after a bad year is the temptation to "swing for the fences" to catch up. An hourly advisor helps you build a strategy that is robust enough to survive a downturn without requiring a 21% "miracle recovery" just to stay on track. They focus on sustainable, repeatable math, not "Hail Mary" investments.
Creating Behavioral Guardrails: When the market is in freefall, your brain screams at you to do something. That "something" is usually a mistake. An hourly planner acts as your behavioral coach, providing a sober, objective second opinion that keeps you from making permanent decisions based on temporary emotions like fear or urgency.
A Custom Blueprint, Not a "Default" Portfolio: You aren't a number, and your life shouldn't be managed by a "model portfolio" designed for the average person. An hourly planner builds a custom blueprint that accounts for your specific taxes, your unique career path, and your actual family needs.
Bottom Line: You Are the CEO, They Are the Consultant
In the traditional world, you are often treated like a "passenger" on the advisor's ship. In the Hourly Financial Advisor Network model, you are the CEO. You are hiring a high-level consultant to give you the raw data and the expert analysis you need to make the best decisions for your family.
Don't wait for a "negative year" to realize your plan was too risky. Book an hour with an objective professional today and ensure that your strategy is built to win—by making sure you don't lose.
Bottom line
The chart’s message is blunt: A large loss doesn’t just hurt—it changes the math of your future. And the larger the loss, the more unrealistic the required recovery becomes. You don’t need the flashiest portfolio to win.
You need a plan that can survive the years when markets don’t cooperate.